Hierarchies in PowerPivot
Posted by denglishbi on May 19, 2010
I saw one of Denny Lee’s tweets this morning titled “Hierarchies, Oh Hierarchies…where are thou? (in PowerPivot)”, so I was intrigued since I just talked about this not being available yesterday in my PASSMN presentation. In his example that he provided was two tables, one for the list of states and another with the city names along with the corresponding state id value reference, and he showed how even though you can relate the two tables that the results could be misleading. If you tried to select the state name and then city name the city name would actually be replicated for each state. Not what you would expect.
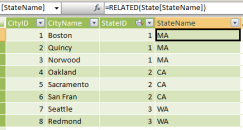
As a work around for this solution he suggested to add a fact table and once that was created then you would see the expected results and the cities would be mapped to the respective states. My thought was to simply add a calculated column in the city table that had the state id mapping. So the tables would look like such:
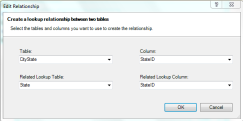
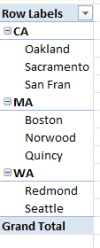
So initially the StateName column did not exist in the city state table I had defined, but once the relationship was in place I simply added a new calculated column in the table using the RELATED DAX function to pull in the state name associated with the cities (see the DAX function in the formula bar in the middle screenshot). Now you can provide the single table for the end-users to reference and they will get the following results:
The good thing about this is that you don’t necessarily need to display the state table anymore since the information is included in the city state table and the end-users will know that the columns are truly related to each other since they are in a single table. Still doesn’t exactly make sense why it didn’t work out-of-the-box originally without the fact table solution that Denny provided, but the calculated column solution takes care of the issue, plus provides the single denormalized table that we would typically see for geography information in this instance.
Now the one thing that you don’t get is the user-defined hierarchy like you have in Analysis Services (SSAS) where you would have the navigation path clearly defined for the users to be able to drag-and-drop and drill down (or up). So when I state that hierarchies are not available this is what I am referring to.


 Subscribe to Blog feed


Tomislav said
There’s no need to add a bridge table as Denny suggested. Your approach is better, denormalizing the table using a calculated column. Still, there’s another one. Put States[StateName] and Cities[CityName] in Rows, then add Cities[StateID] (FK) in Values using the Count aggregation. It will shrink the result as required. If you miss and put States[StateID] (PK) instead, it won’t work, naturally, because relations are one way only.If you have SharePoint, you can deploy this and see what MDX is issued by Excel (Services?) in case there is no measure. Maybe it rings the bell why it behaves that way.
Darren said
I suspect that this issue comes about because under the covers PowerPivot treats each table as a separate dimension. In Denny’s post it’s only when you drag a measure onto your pivot table that it can do a "Non Empty" on the results to exclude State/City combinations that have no data. I think I like your approach. It is probably less confusing for the end users, but a bit more work for the person building the model.